| ||||||||||||||||||||||||||||||||||||||||||||||||||||||||||||||||||||||||||||||||||||||||||||||||
|
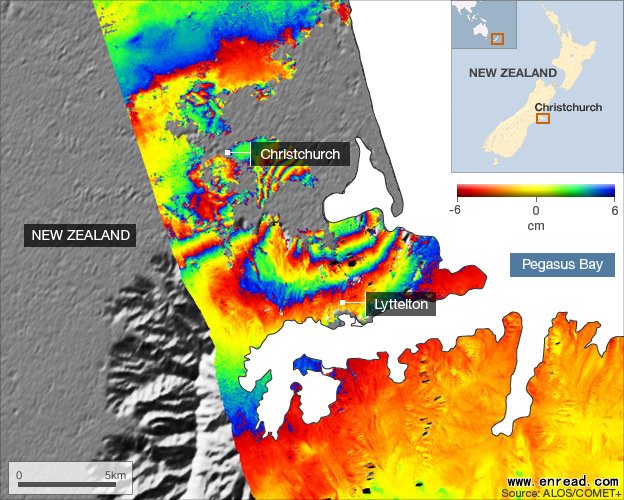
The upheaval1 wrought2 by the 22 February earthquake in Christchurch, NZ, is illustrated3 in new radar4 imagery. 2月22日新西兰城市克赖斯特彻奇大地震的雷达图像已经制作完成。  The coloured bands, or fringes, represent movement towards or away from the spacecraft Data from the Japanese Alos spacecraft has been used to map the way the ground deformed7 during the most recent quake. It shows clearly that the focus of the tremor was right under the city's south-eastern suburbs. The type of image displayed on this page is known as a synthetic8 aperture9 radar(合成孔径雷达) interferogram(干涉图) . It is made by combining a sequence of radar images acquired by an orbiting satellite "before" and "after" a quake. The technique allows very precise measurements to be made of any ground motion that takes place between the image acquisitions(兼并,获得) . The coloured bands, or fringes(条纹,边缘) , represent movement towards or away from the spacecraft. In this interferogram, the peak ground motion is almost 50cm of motion towards the satellite. "It's like a contour map(等高线图) but it's showing to the south-east of Christchurch that the ground motion is towards Alos. That's uplift," explained Dr John Elliott from the Centre for the Observation and Modelling of Earthquakes and Tectonics (Comet) at Oxford10 University, UK. "And then right under Christchurch, we see subsidence(下沉) . That's partly due to liquefaction(液化,熔解) but it's mainly due to the way the Earth deforms11 when you snap it like an elastic12 band." Where the rainbow fringes become most tightly spaced is where the fault break came closest to the surface, although the data indicates the fault is unlikely to have broken right through to the surface. 点击  收听单词发音 收听单词发音
|
||||||||||||||||||||||||||||||||||||||||||||||||||||||||||||||||||||||||||||||||||||||||||||||||
上一篇:英国解密UFO档案 下一篇:2011年妇女节主题“女性平等” |
||||||||||||||||||||||||||||||||||||||||||||||||||||||||||||||||||||||||||||||||||||||||||||||||
- 发表评论
-
- 最新评论 进入详细评论页>>


